What the Process LogShip web app shows you
A dashboard of the most recent alarms, a log viewer that filters by source, severity, replicator and time zone, source vitals, a topology view, user permissions, and a light and dark mode.
Process LogShip is a single pane of glass for all AVEVA and Wonderware System Management Console logs, across your entire network, designed to minimise the time you spend reviewing diagnostic logs.
Process LogShip collects SMC logs on each machine and consolidates them in a SQL Server database, local or remote. The logs can then be forwarded to a central, web-based Receiver for unified analysis. As they are consolidated, logs can be deduplicated, and older messages auto-purged based on criteria you define.
The dashboard
Process LogShip includes a web-based dashboard that surfaces the most recent alarms and warnings and lets you inspect each one in detail: the exact message, the timestamp, the originating SCADA node, and more.
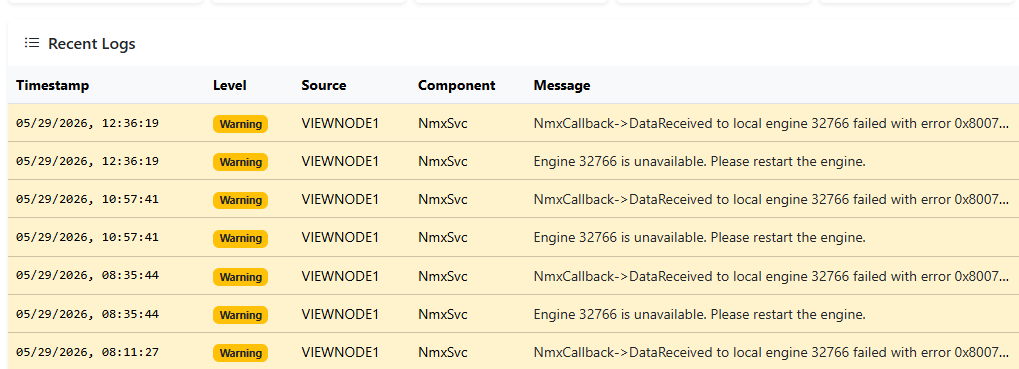
The dashboard also charts the last 30 days of alarm messages, so you can quickly spot the days or time frames when errors and warnings spiked.
The log viewer
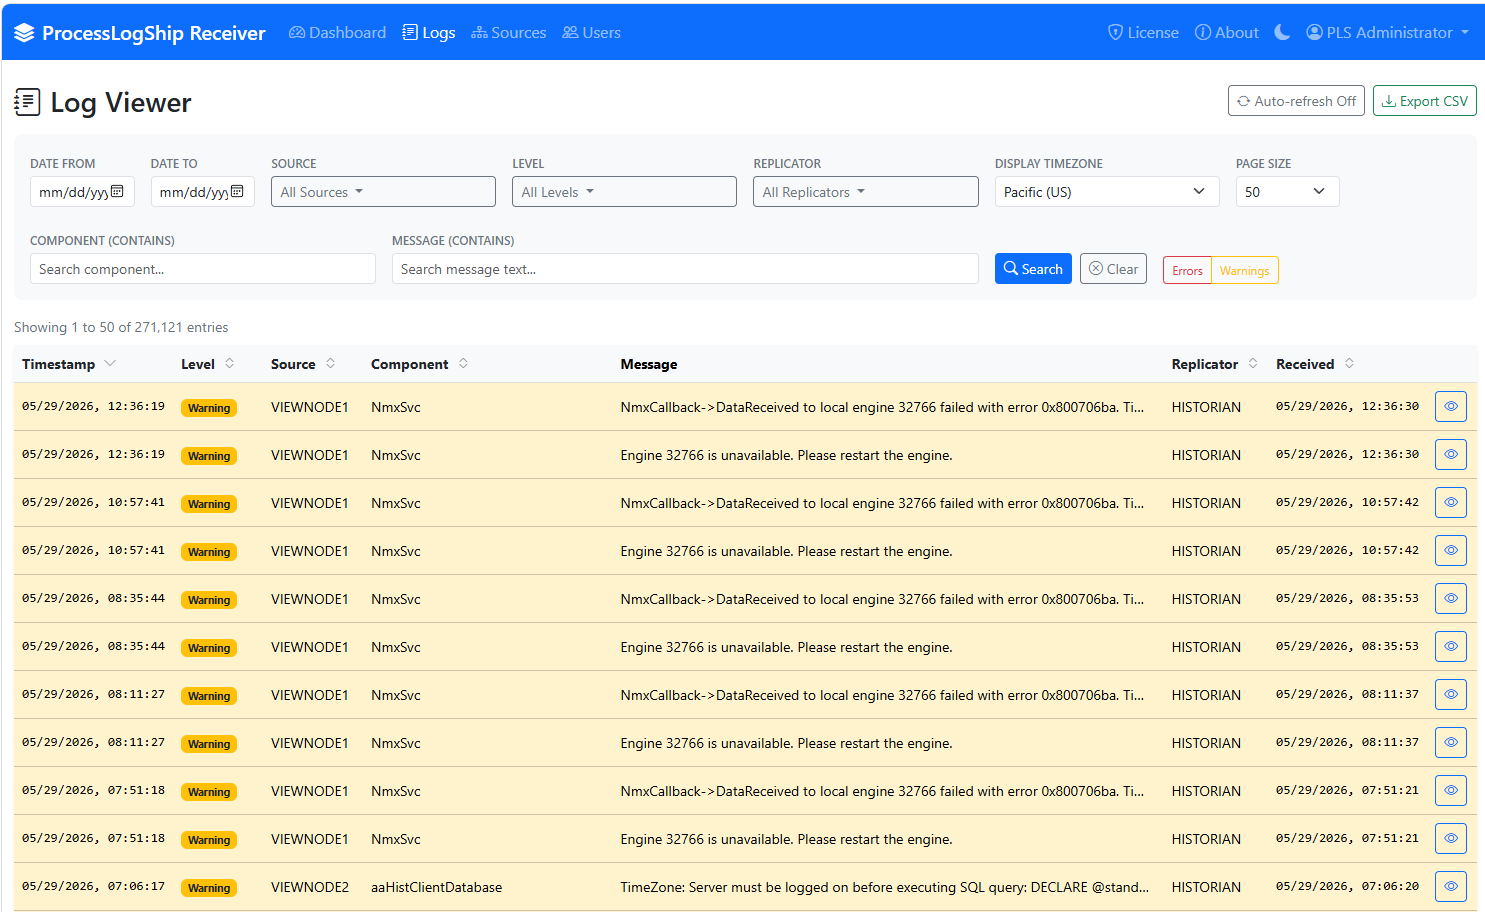
The web app includes a log viewer where you can filter alarms, errors and warnings by date and time, source, severity or replicator, and display messages in any time zone. In just a few clicks you can pull, say, every error across the whole system and review them one at a time. Any set of results can be exported to CSV.
Source status and topology
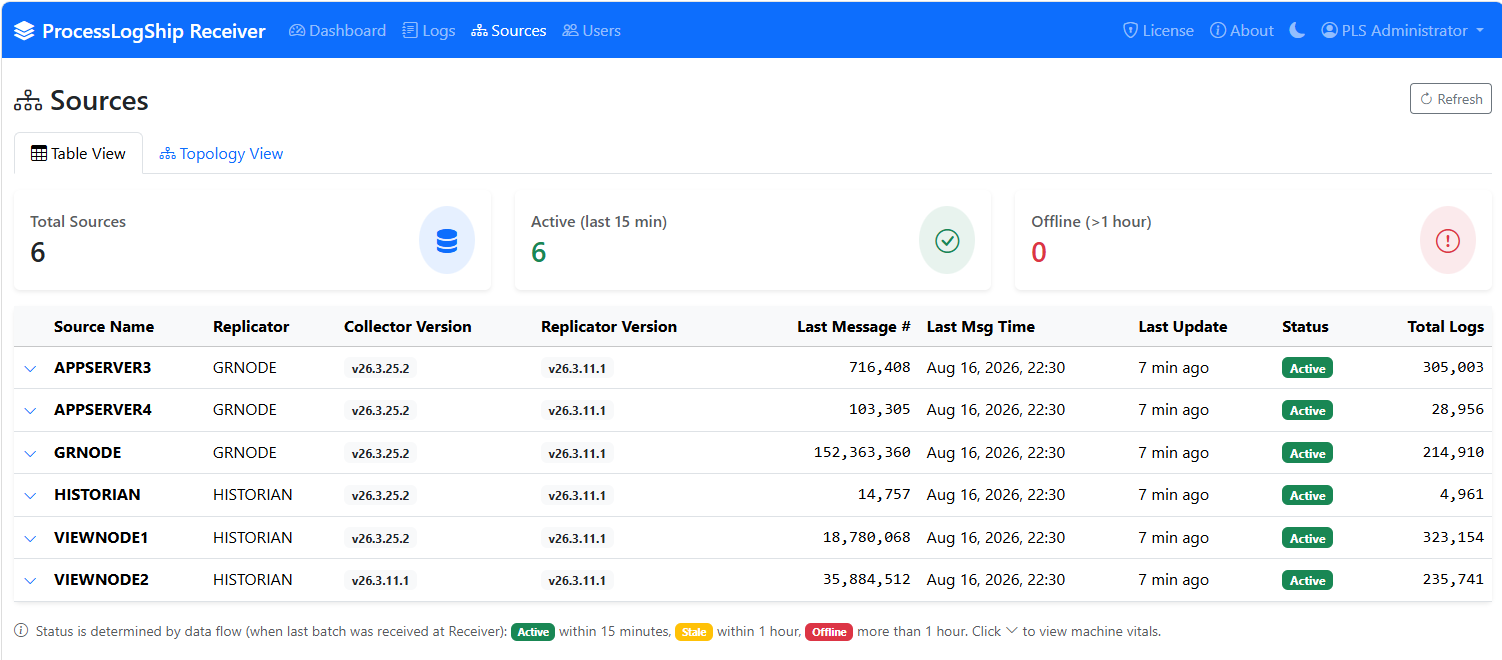
Admins can review the status of each log source to confirm it is connected to the portal, along with the last-message timestamp and basic vitals like CPU, RAM and free disk space. The same information appears in a topology view that groups source nodes under their data replicators.
Admins can also create additional user accounts and set their permissions.
And everything can be viewed in light or dark mode, for those who are keen on it.
If you would like to see what this would look like across your own ICS estate, we would love to talk.