Process LogShip
Consolidate AVEVA log data from every node into one pane of glass.
Your control system logs everything, and then leaves it stranded. The System Management Console will show you one remote machine's log at a time, so tracing a problem that crosses nodes means remoting into server after server and holding the sequence together in your head.
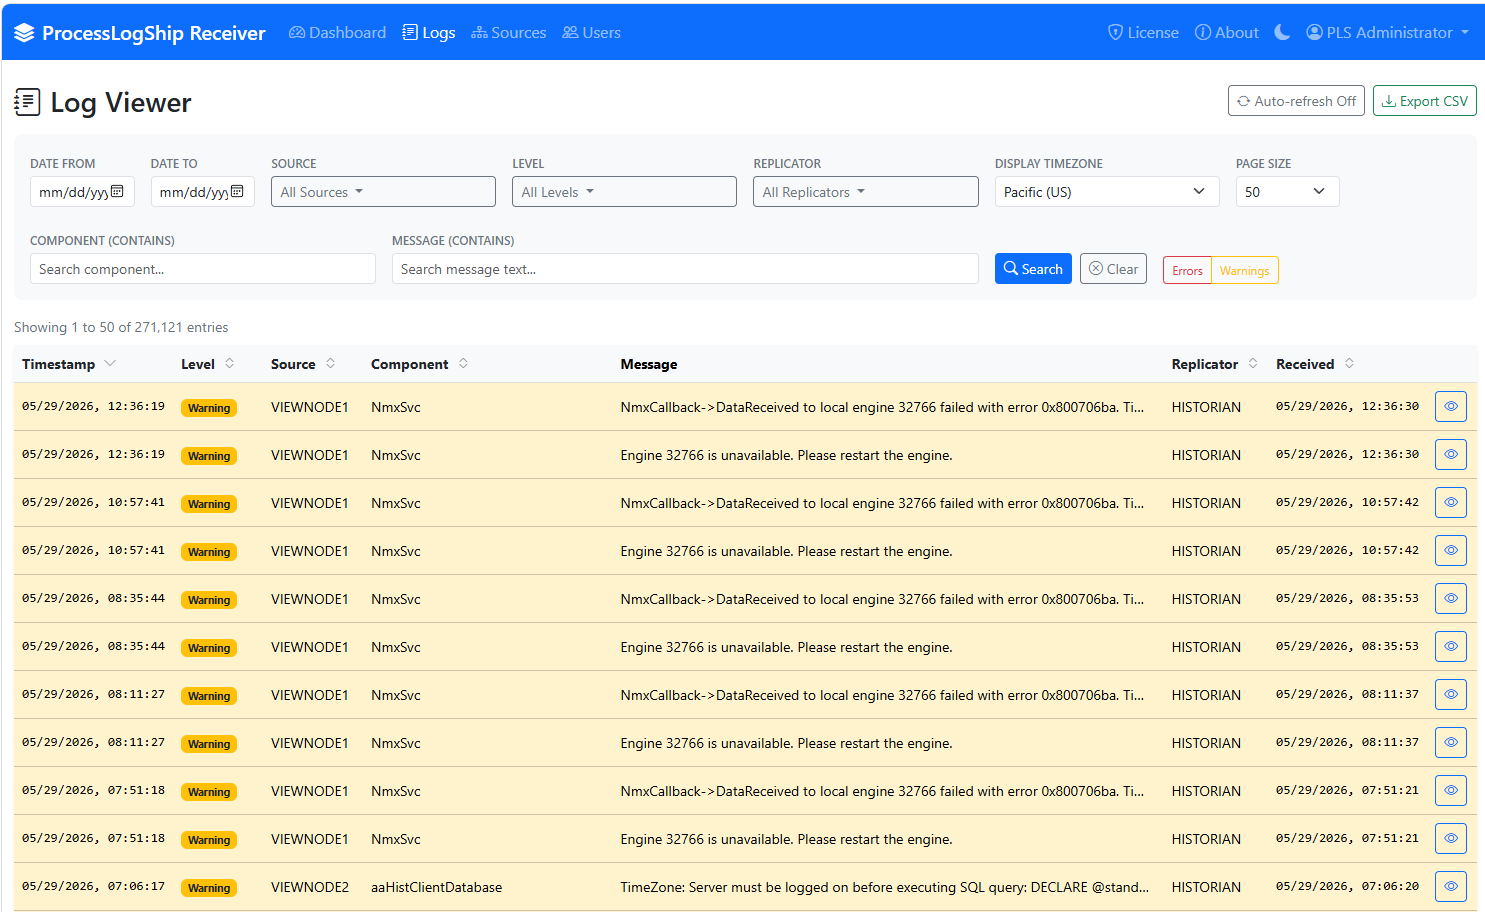
Process LogShip collects those logs where they are written and consolidates them into one searchable view of the whole estate.
What it does
- Reads AVEVA and Wonderware logs directly. The Collector parses the proprietary binary aaLOG files written by the System Management Console and stores structured records in SQL Server.
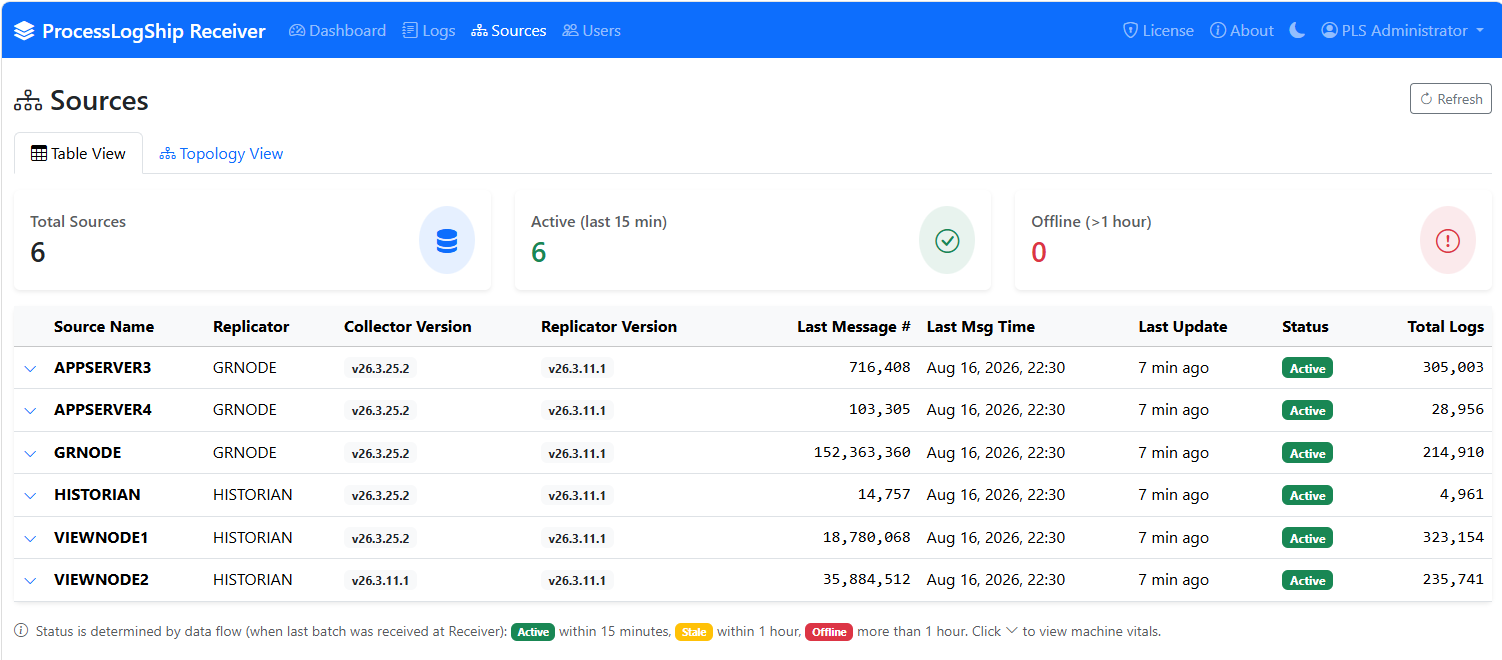
- One search across every node. The Receiver gives you a web dashboard with log search, filtering and CSV export, plus per-source status showing which nodes have gone quiet.
- One-way flow, OT to IT to cloud. Traffic goes out over HTTPS with API key authentication. Nothing connects inward to the OT network.
- Does not drop records. Infinite retry with backoff means a network outage delays delivery rather than losing data.
- Ships to the platform you already use. SQL Server for Power BI, or Seq and Grafana Loki for structured logging and your SIEM.
- Keeps the volume manageable. Deduplication at each stage, filtering by source and log level, repeated message suppression, and configurable purging.
- Runs on SQL Express. Built-in protection against the 10 GB database limit, plus disk space monitoring that pauses and resumes collection.
How it works
Four components in one pipeline. The Collector and Replicator sit in the OT network. The Receiver, a web application, sits in the DMZ or on your IT network. The CloudReplicator forwards logs onward to your enterprise platform.
Every hop is initiated from the inside out, so no inbound connection into the OT network is required at any stage. All four are Windows services with GUI configuration editors, so deployment does not need scripting or command line work.
Use cases
Centralised troubleshooting. A batch fails and the cause is somewhere across six nodes. Instead of remoting into each one and reading logs in isolation, you search the whole estate at once, filter to the minutes either side of the failure, and see the sequence in order across every machine that took part.
Compliance and audit. A regulator or an internal audit asks for evidence covering a period months back. The logs are already consolidated, retained on the schedule you set, and exportable, so answering is a search and an export rather than a salvage operation across servers that may since have been rebuilt.
Questions
Does it need an inbound connection into the OT network? No. Data flows one way only, OT to IT to cloud, over HTTPS with API key authentication. Nothing initiates a connection inward.
Which logging platforms can it feed? SQL Server for Power BI and direct reporting, Seq for structured logging, and Grafana Loki. The Receiver also stands on its own if you just want the dashboard and search.
What happens during a network outage? Delivery is delayed, not lost. Each stage retries indefinitely with backoff and resumes where it left off once the link returns.